

How a Tally Dashboard Turns Raw Data into Business Insights
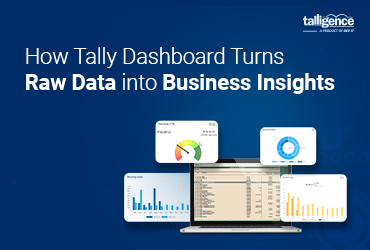
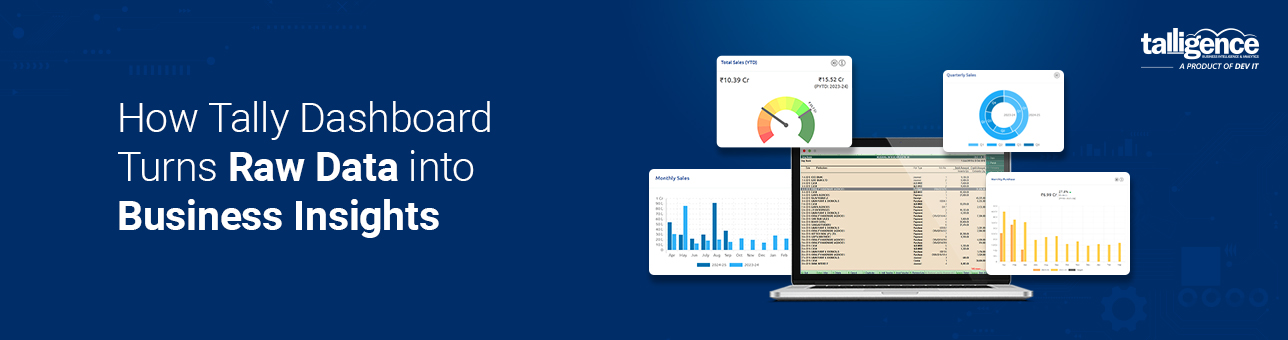
If you’ve had experience with Tally, you know that it’s excellent for maintaining your books. However, allow me to share a secret with you: although Tally excels at posting transactions, it may not necessarily provide a comprehensive understanding of your business’ health.
You can generate reports or sort through vouchers, but once you’ve sifted through all that information, the next step is turning those numbers into meaningful business insights. That’s where Talligence helps by presenting your Tally data through real-time analytics, interactive dashboards, and actionable insights.
The actual challenge is making those numbers work. Which product line is performing best? Where are your sales trends heading? A Tally dashboard can tell you. It provides a visual, real-time view of your business’s sales trends, past-due invoices, and expenses in one place. You’re not just seeing numbers; you’re viewing the story behind them.
Why Businesses Extend Tally with BI Dashboards
Tally is the backbone of financial management for thousands of businesses. It is a trusted accounting solution that provides accurate financial records, detailed reports, and reliable day-to-day business management.
As businesses grow, however, decision-makers often require deeper analytical insights beyond standard accounting reports. This is where Business Intelligence (BI) dashboards complement Tally.
Organizations commonly face challenges such as the following:
- Working with multiple reports to answer different business questions.
- Combining information from different departments for management reporting.
- Tracking KPIs in real time instead of relying only on periodic reports.
- Identifying trends, exceptions, and business opportunities through visual dashboards.
- Reducing the time spent consolidating data so teams can focus more on analysis and strategic planning.
In short, Tally provides a strong foundation for accounting and financial management, while BI dashboards enhance that data with interactive visualizations, real-time KPIs, and business insights that support faster, more informed decisions.
The Role of Dashboards in Modern Business
A dashboard is not just a collection of charts. Think of it as a lens that makes your business clear. It gathers data from various reports, accounts, and systems and presents it in a single, interactive snapshot.
The following are the most used types:
- Financial Dashboards
- Monitor revenue, expenses, and key business metrics.
- Track key ratios in real time.
- Executive Dashboards
- Provide CEOs and CFOs with a high-level picture of important business KPIs.
- Allow drilldowns to gain deeper insights without having to chase multiple reports.
With Talligence Dashboards, complex Tally data becomes clear, actionable, and visually intuitive. Accountants, managers, and executives can focus on decisions instead of number-crunching.
How Tally Dashboard Turns Raw Data into Insight
Let’s unpack how dashboards create value:
-
- Data Consolidation
If you have several branches or business units under your management, pulling all your Tally information together can be a nightmare. A dashboard consolidates it into one place, giving you end-to-end visibility. - Real-Time Visibility
Waiting for monthly reports is intolerable. Dashboards update dynamically, providing you with real-time visibility into your business. - Making Numbers Visual
Spreadsheets get the job done, but they’re not intuitive for decision-makers. Dashboards turn raw data into charts, graphs, and KPIs that make trends transparent. - Identification of Trends and Predictions
Dashboards do more than report on current conditions; they expose trends that enable future predictions.- Is spending growing faster than income?
- Is a specific product category performing better than others?
- Are late payments on the rise?
- Data Consolidation
By making these insights available, you can make better plans and proactive decisions, not just reactive ones.
-
- Drill-Down Analysis
A good dashboard lets you drill down. Start with total company sales, then drill into regions, products, or even customers, without switching between several reports. - Alerts and Notifications
Dashboards can monitor problems on your behalf. Automated notifications inform you when something requires attention.
- Drill-Down Analysis
The Business Value of a Tally Dashboard
The benefits of transforming raw data into answers are real:
- Fast decision-making: Leaders have answers when they need them.
- Increased productivity: Finance teams spend more time analyzing and less time reporting.
- Greater financial control: Real-time cash visibility helps avoid surprises.
- Competitive edge: Companies that act on insights outperform those mired in spreadsheets.
Dashboards shift your mindset from reactive to proactive, enabling you to run the business, not just the books.
Why Talligence Is Tally User-Friendly
Not all dashboards are created equal. Generic business intelligence solutions are often complex, time-consuming, and IT-dependent.
Talligence Dashboard is specifically designed for Tally reporting, offering:
- Seamless integration: Plug-and-play with your current Tally data.
- Pre-built KPI dashboards: Ready for CEOs, CFOs, and finance teams.
- Pre-Built Dashboards: Access ready-to-use dashboards for tracking key business metrics and performance.
- Cloud access: View insights anytime, anywhere.
With Talligence, you’re not just looking at numbers; you’re understanding the story behind them.
Conclusion
Raw Tally data is valuable, but without context, it’s just numbers. A dashboard transforms those numbers into actionable insights, helping business leaders make faster, smarter decisions.
For business owners, CFOs, and CEOs, the difference is clear. Rather than responding to stale reports, you can make decisions based on real-time insights, improving efficiency and business performance. This dynamic approach empowers organizations to pivot quickly in a fast-paced market. By leveraging these insights, teams can collaborate more effectively, driving innovation and ensuring they stay ahead of the competition.
Ready to move beyond spreadsheets? Unlock the full potential of your Tally data and make smarter, faster decisions. Discover the power of Talligence Start your 7-day free trial now and experience the full power of Talligence Dashboard today!


